逻辑回归
逻辑回归 (Logistic Regression) 是一种非常容易实现的分类模型,对于线性可分的情况有很好的表现。与之前文章中的感知器和 Adaline 类似,本文中的逻辑回归也是二元分类的线性模型。
算法思想
为了解释逻辑回归模型背后的思想,先介绍一个概念:比值比 (Odds ratio,OR)。
比值比的数学表示为 ,其中 为某事件可能发生的几率。
在此基础上,定义 logit 函数,即比值比的对数 (计算机科学中 表示自然对数):
logit 的作用是将范围为 的变量,映射到整个实数集。
对于给定的 :
- 的概率 在 之间。
- 基于神经元模型,输出的概率是由净输入 得到的。
基于以上逻辑,建立 的 logit 映射:
因此,logit 的反函数即为 的映射:
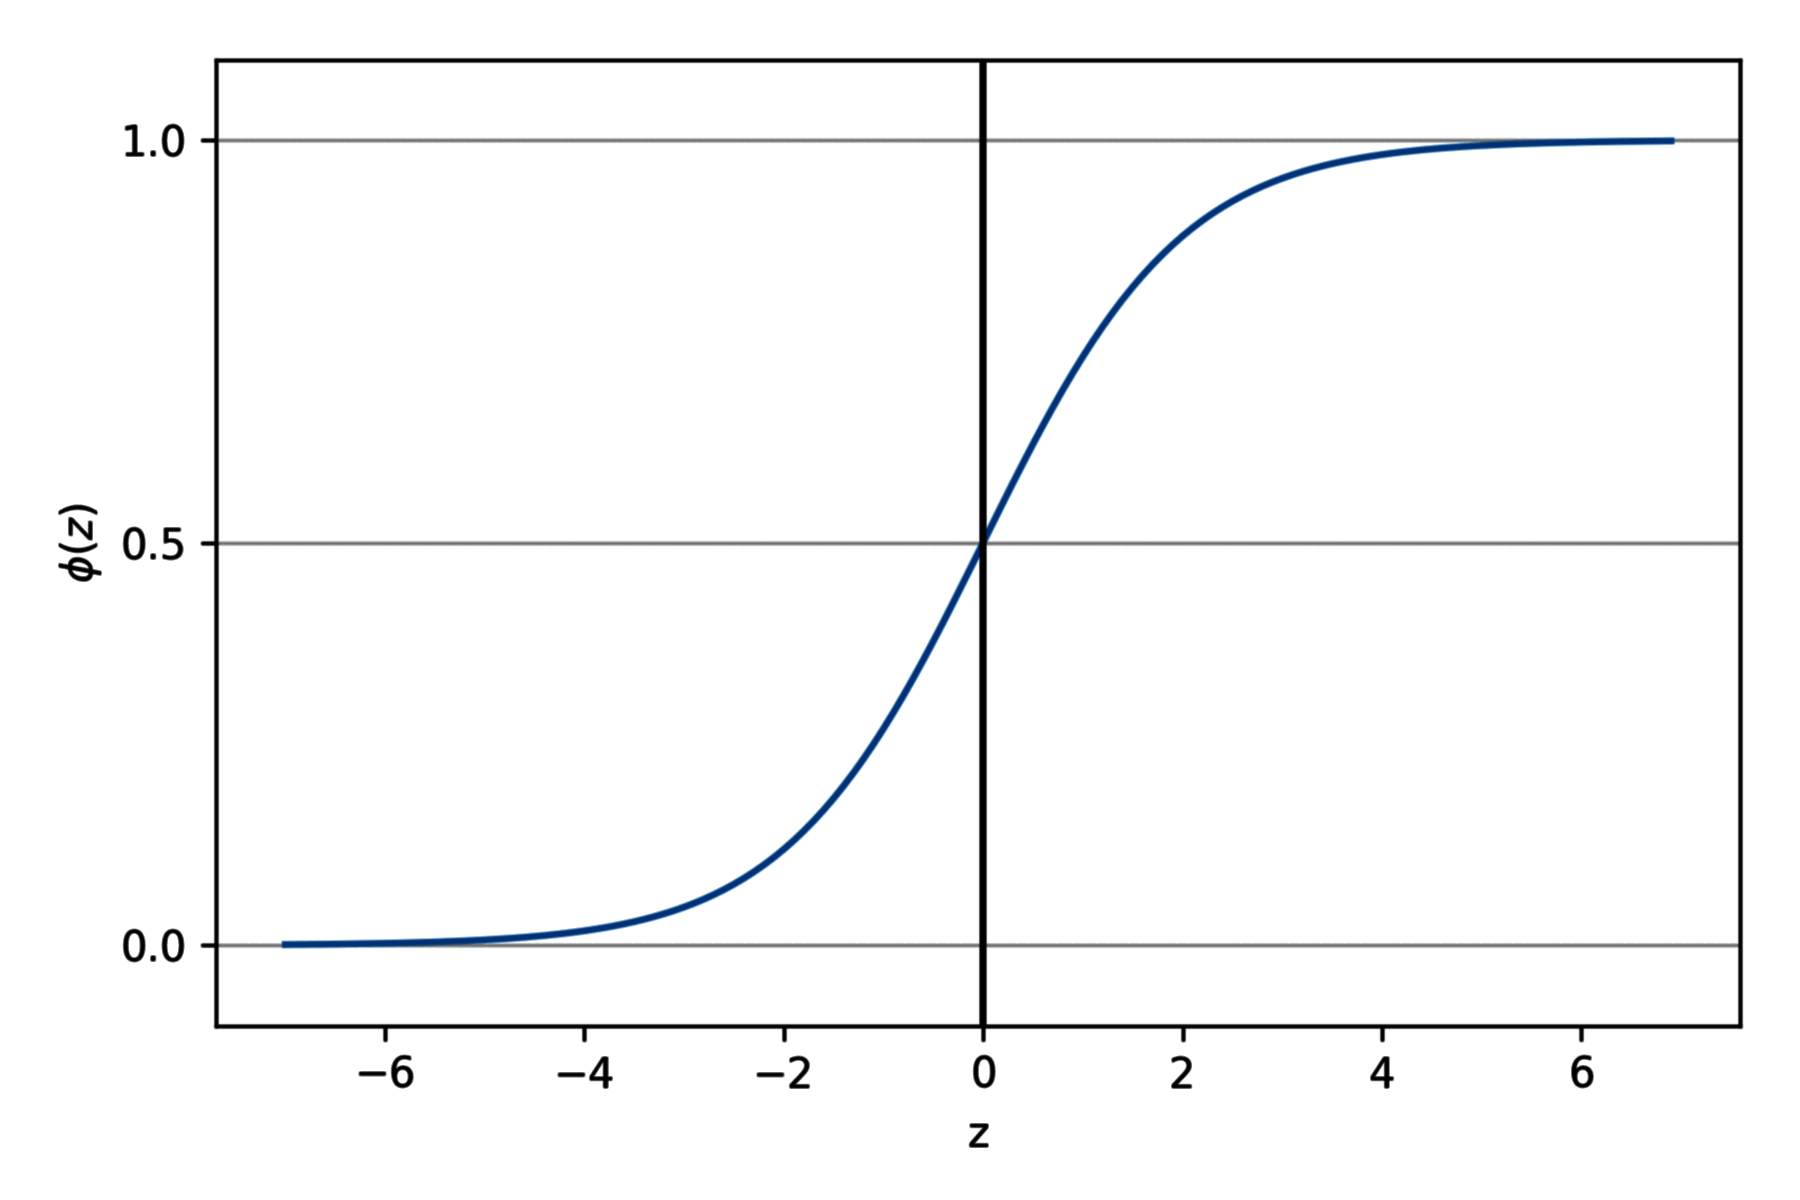
这里 称为 logistic sigmoid 函数,通常简称为 sigmoid 函数。(sigmoid 意为 S-shaped,即 S 形状的曲线。)
import matplotlib.pyplot as plt
import numpy as np


def sigmoid(z):
    return 1.0 / (1.0 + np.exp(-z))


z = np.arange(-7, 7, 0.1)
phi_z = sigmoid(z)

plt.plot(z, phi_z)
plt.axvline(0.0, color="k")
plt.ylim(-0.1, 1.1)
plt.xlabel("z")
plt.ylabel("$\phi (z)$")
plt.yticks([0.0, 0.5, 1.0])
ax = plt.gca()
ax.yaxis.grid(True)
plt.show()

算法模型
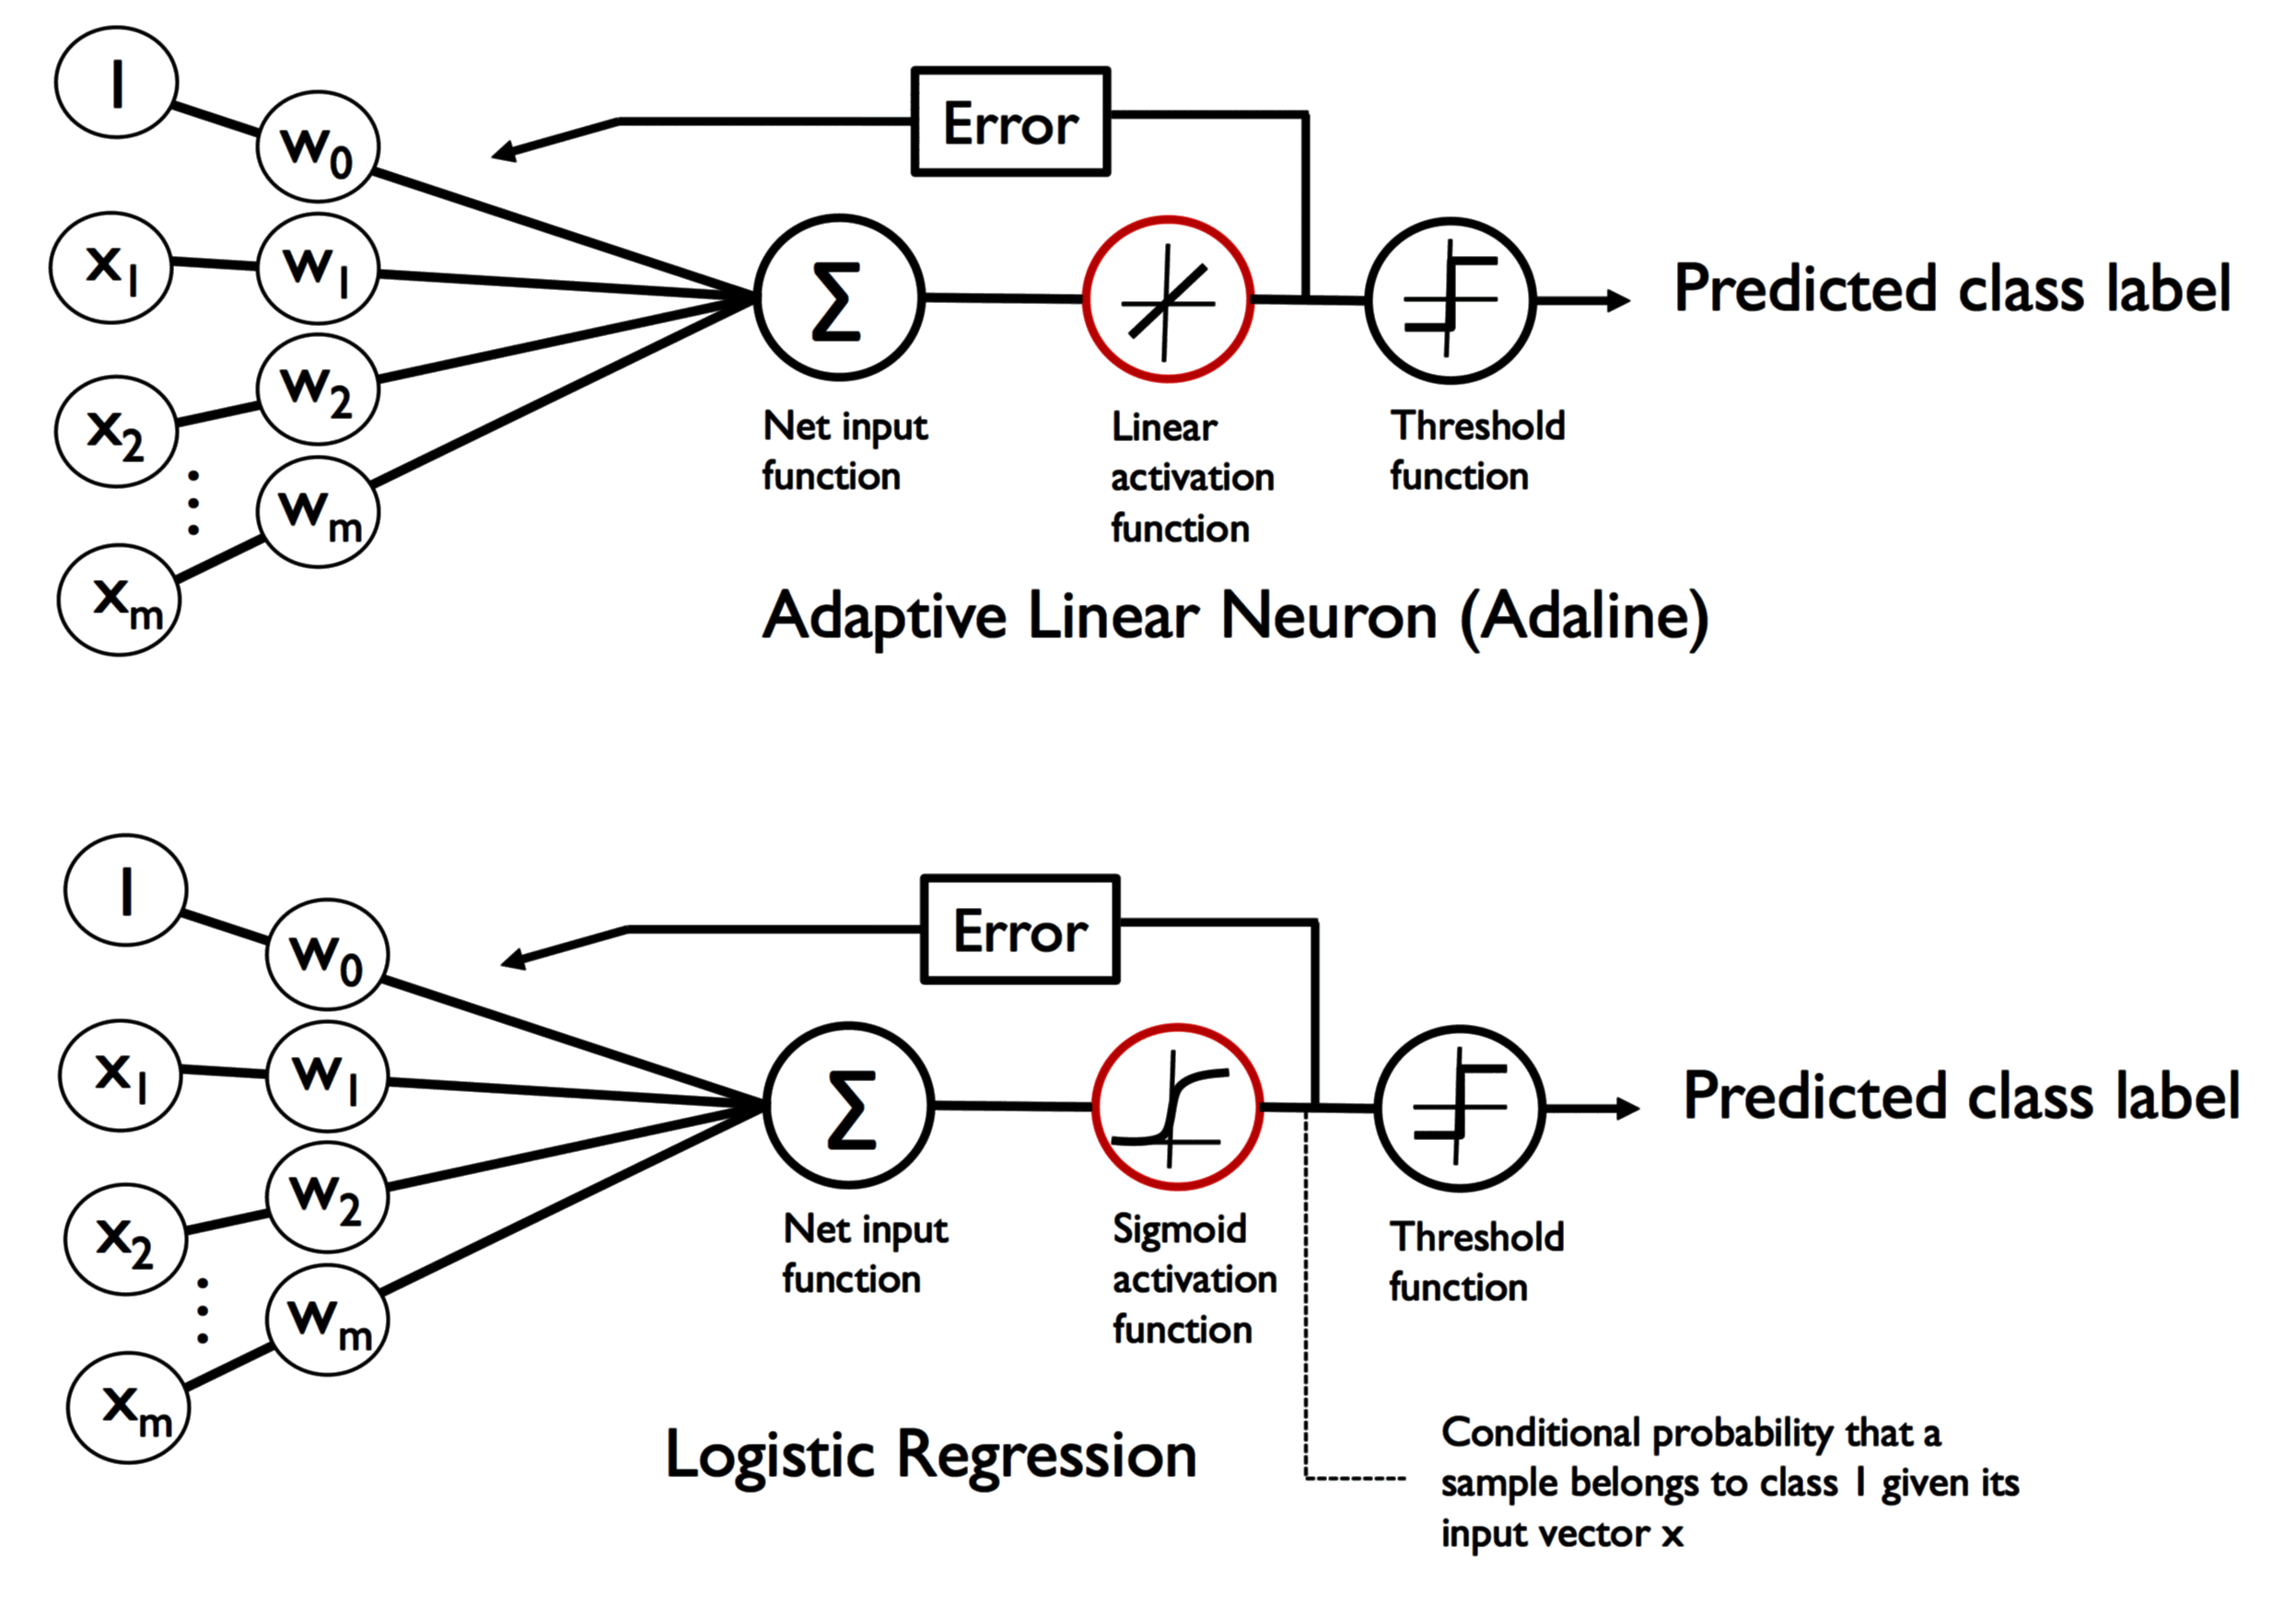
Adaline 和逻辑回归的差异,如下图所示:

Adaline:
- 激活函数:线性函数
- 阈值函数:阶跃函数
逻辑回归:
- 激活函数:sigmoid 函数
- 阈值函数:阶跃函数
需要注意的是,逻辑回归中的条件 ,等价于 。
损失函数和成本函数
定义损失函数 (Loss Function) 和成本函数 (Cost Function),以训练权重参数 。
损失函数用于单个样本,代表预测输出 和实际输出 之间的误差。
- 当 时,最小化 等价于 接近于 1。
- 当 时,最小化 等价于 接近于 0。
成本函数是整个训练集的损失函数的平均值。最小化成本函数,可以得到最优的参数 。
Python 实现
逻辑回归的实现如下,使用梯度下降法进行参数训练:
import numpy as np


class LogisticRegressionGD(object):
    def __init__(self, eta=0.05, n_iter=100, random_state=1):
        self.eta = eta
        self.n_iter = n_iter
        self.random_state = random_state

    def fit(self, X, y):
        rgen = np.random.RandomState(self.random_state)
        self.w_ = rgen.normal(loc=0.0, scale=0.01, size=1 + X.shape[1])
        self.cost_ = []
        for i in range(self.n_iter):
            net_input = self.net_input(X)
            output = self.activation(net_input)
            errors = y - output
            self.w_[1:] += self.eta * X.T.dot(errors)
            self.w_[0] += self.eta * errors.sum()
        cost = -(y.dot(np.log(output)) + ((1 - y).dot(np.log(1 - output)))) / X.shape[0]
        self.cost_.append(cost)
        return self

    def net_input(self, X):
        return np.dot(X, self.w_[1:]) + self.w_[0]

    def activation(self, z):
        return 1.0 / (1.0 + np.exp(-np.clip(z, -250, 250)))

    def predict(self, X):
        return np.where(self.net_input(X) >= 0.0, 1, 0)
绘制图像
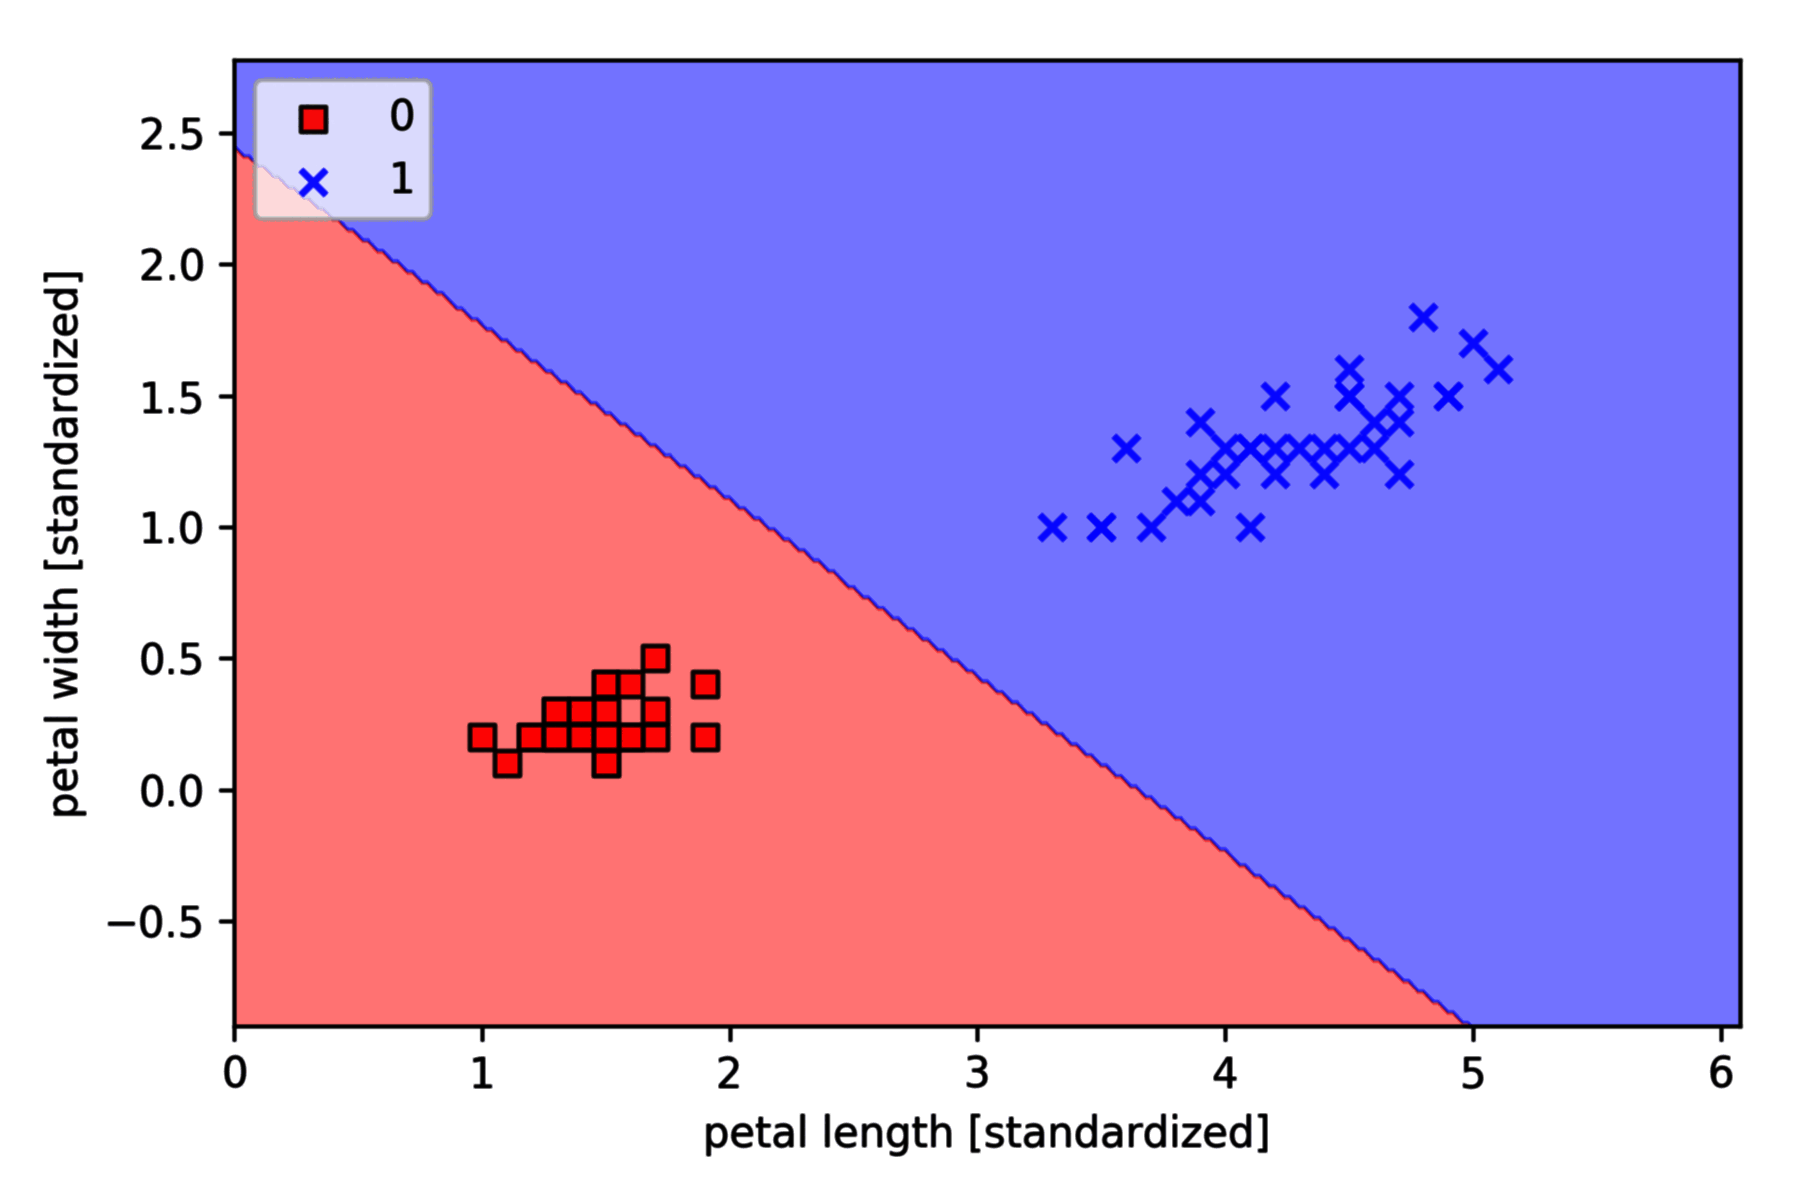
以 Iris-setosa (标签 0) and Iris-versicolor (标签 1) 为例,采用逻辑回归分类,绘制决策边界如下,
import matplotlib.pyplot as plt
from plot_decision_regions import plot_decision_regions
from sklearn import datasets
from sklearn.model_selection import train_test_split

iris = datasets.load_iris()
X = iris.data[:, [2, 3]]
y = iris.target

X_train, X_test, y_train, y_test = train_test_split(X, y, test_size=0.3, random_state=1, stratify=y)

X_train_01_subset = X_train[(y_train == 0) | (y_train == 1)]
y_train_01_subset = y_train[(y_train == 0) | (y_train == 1)]

lrgd = LogisticRegressionGD(eta=0.05,n_iter=1000,random_state=1)
lrgd.fit(X_train_01_subset,y_train_01_subset)

plot_decision_regions(X=X_train_01_subset,y=y_train_01_subset,classifier=lrgd)
plt.xlabel('petal length [standardized]')
plt.ylabel('petal width [standardized]')
plt.legend(loc='upper left')
plt.show()
